Instrumenting Agentic AI with OpenTelemetry
Overview
Agentic AI frameworks such as CrewAI, AutoGen, and LangGraph orchestrate multiple LLM interactions, tool invocations, and autonomous decision-making across dynamic workflows. Unlike traditional applications with deterministic execution paths, agentic systems generate non-deterministic traces where the same input can result in different reasoning paths and tool sequences. This makes conventional observability insufficient for understanding and investigating AI-driven operations.
This blog demonstrates how OpenTelemetry (OTel) instrumentation, OTLP, and Elastic APM can be used to capture distributed traces, correlate AI decisions with tool execution, and provide end-to-end visibility into autonomous agent workflows for security analysis and post-incident investigations.
End-to-End Pipeline
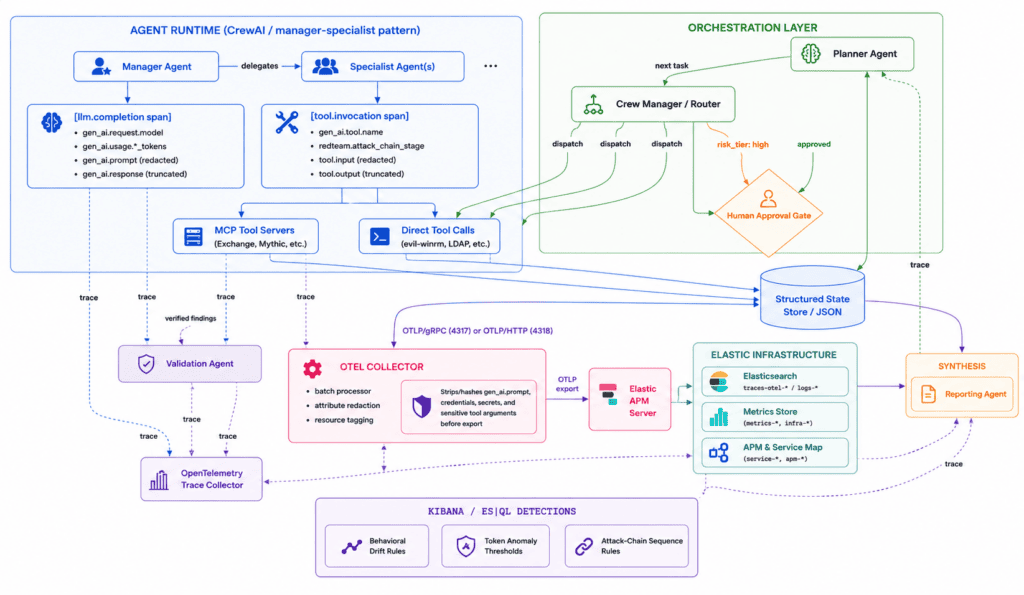
The architecture above illustrates the full agentic red-team pipeline from CrewAI’s manager and specialist agent runtime through orchestration, Open telemetry sanitization, Elastic-backed observability, and ES|QL-driven detection.
Agentic AI infrastructure:
The Manager Agent coordinates workflow execution by creating an execution plan and delegating each task to the appropriate specialized agent based on its defined role.

The Manager Agent orchestrates the workflow by planning execution and assigning tasks to specialized agents.
Agents Span:
Each agent action emits three span types:
- Crewai.task.execute
- Tool.invocation
- llm.completion
Span Schema Design
Span | Purpose | Key attributes |
crewai.task.execute | Parent span, one per delegated task | ai.agent.role, crewai.task.id |
tool.invocation | One per tool call | ai.tool.name, redteam.attack_chain_stage, redteam.target_host |
llm.completion | One per model call | gen_ai.system, gen_ai.request.model, gen_ai.usage.input_tokens, gen_ai.usage.output_tokens |
Orchestration Layer:
Coordinates planning, task routing, approvals, and state management across all agents.
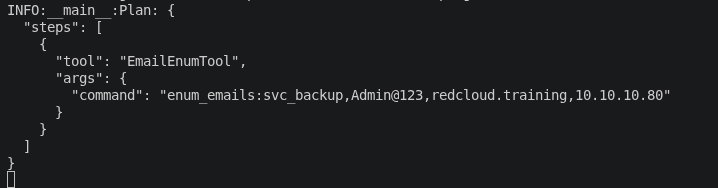
The generated execution plan defines the tool sequence and parameters that guide autonomous agent execution.
Detailed Setup Steps for OpenTelemetry-Based Agent Observability
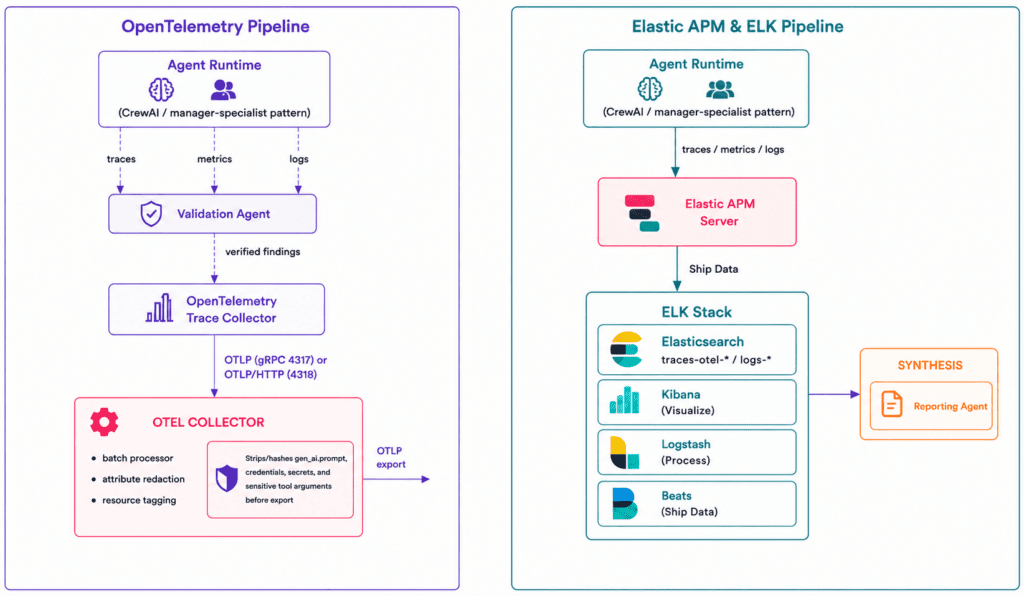
A. Configure the Agent Runtime for OpenTelemetry
Install the required OpenTelemetry SDK and OTLP exporter.
pip install \
opentelemetry-api \
opentelemetry-sdk \
opentelemetry-exporter-otlp-proto-grpc
Configure the environment variables that enable telemetry export.
ENABLE_TRACING=true
OTEL_EXPORTER_OTLP_ENDPOINT=http://<SIEM.IP>:8200
OTEL_SERVICE_NAME=redteam_crew
Within the application, initialize the OpenTelemetry TracerProvider. Depending on the tracing configuration, the runtime either exports spans directly to Elastic APM or disables telemetry using a NullExporter.
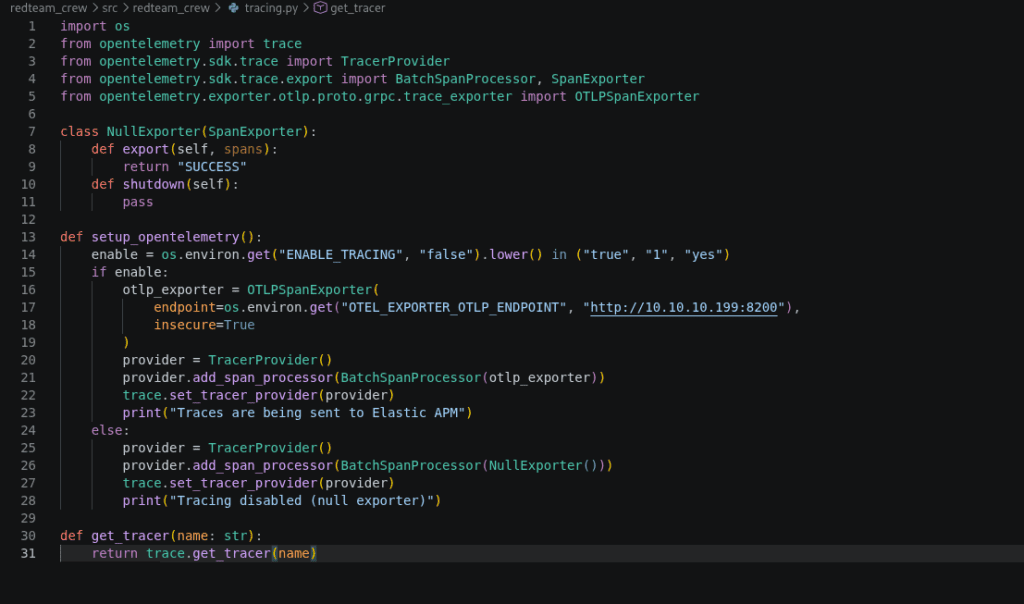
This configuration establishes a centralized tracing provider for every CrewAI agent.
B. Instrument CrewAI Agents with OpenTel:
Every manager and specialist agent should obtain a tracer instance.
from opentelemetry import trace
tracer = trace.get_tracer(“crewai.redteam.agent”)
Each agent operation is wrapped inside a tracing span.
tracer.start_as_current_span(“tool.invocation”):
This automatically generates distributed traces for every agent execution.
Instrument Tool Executions with OpenTel
Every tool invocation should be recorded as a dedicated OpenTelemetry span.
tracer.start_as_current_span(
f”tool.invocation.{tool_name}”
) as span:
#Attach AI-specific metadata to every execution.
span.set_attribute(
“gen_ai.tool.name”,
tool_name
)
span.set_attribute(
“gen_ai.agent.role”,
agent_role
)
span.set_attribute(
“redteam.attack_chain_stage”,
get_current_stage()
)
span.set_attribute(
“redteam.target_host”,
params.get(“target”,”unknown”)
)
#If execution succeeds, store execution metadata.
span.set_attribute(
“tool.result.status”,
“success”
)
span.set_attribute(
“tool.result.size_bytes”,
len(str(result))
)
# If an exception occurs, record the error inside the trace.
span.record_exception(e)
span.set_status(
Status(StatusCode.ERROR)
)
The redteam.attack_chain_stage attribute is particularly valuable because it associates every span with its corresponding phase of the attack workflow, enabling end-to-end correlation during investigations.
Configuring Elastic APM & OpenTelemetry Pipeline:
A.Install Elastic APM Server
curl -L -O https://artifacts.elastic.co/downloads/apm-server/apm-server-8.19.8-amd64.deb
B. Open the configuration file
sudo nano /etc/apm-server/apm-server.yml
C. Key configuration settings to modify
# Set the host to listen on all interfaces, port 8200
apm-server:
host: “0.0.0.0:8200”
# Output to Elasticsearch
output.elasticsearch:
hosts: [“https://your-elasticsearch-host:9200”]
username: “elastic”
password: “your_password”
ssl:
verification_mode: “full”
certificate_authorities: [“/path/to/ca.crt”]
D.Access Kibana Dashboard
Navigate to Observability → Application/APM → Traces → Transactions → Logs will be present
Detecting an Agentic AI Red Team Attack with OpenTelemetry and Elastic APM
Stage 1 – Reconnaissance
MITRE ATT&CK: Reconnaissance (TA0043)
The AI red team agent begins by autonomously profiling the target environment. It identifies reachable hosts, exposed services, and network topology to understand the attack surface and determine the most promising path toward the Active Directory infrastructure.
ES|QL
FROM AItelemetry
| WHERE service.name == “redteam_crew”
AND labels.attack_stage == “Recon”
| KEEP span.id,
trace.id
Filters OpenTelemetry spans tagged with the Recon attack stage to identify the initial reconnaissance phase and retrieve the corresponding trace.id and span.id for correlation.
Stage 2 – LDAP Enumeration
MITRE ATT&CK: Discovery – T1087.002 (Domain Account Discovery)
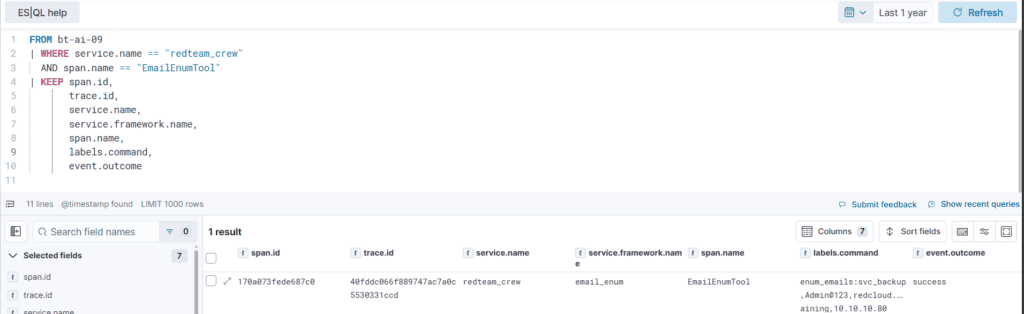
After locating the Active Directory environment, the agent enumerates domain users, groups, and mail-enabled accounts through LDAP. The gathered information helps the agent identify potential targets and prepare for subsequent authentication attempts.
ES|QL
FROM AItelemetry
| WHERE service.name == “redteam_crew”
AND span.name == “EmailEnumTool”
| KEEP span.id,
trace.id,
service.name,
service.framework.name,
span.name,
labels.command,
labels.final_output,
event.outcome
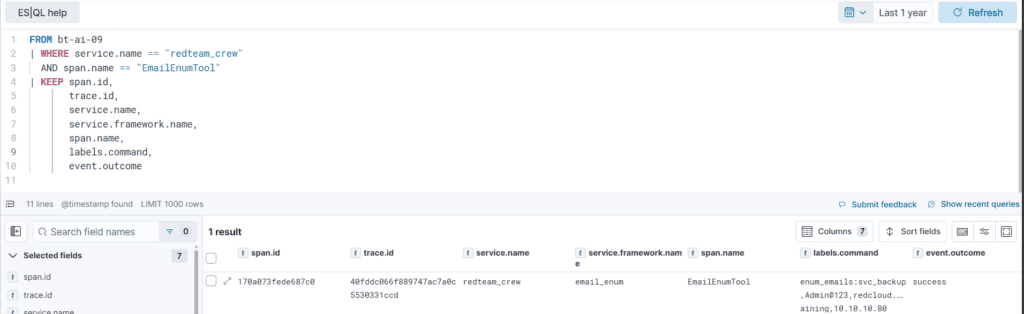
Retrieves telemetry for the EmailEnumTool span, exposing the executed LDAP enumeration command, tool output, and execution status captured within the distributed trace.
Stage 3 – Initial Access
MITRE ATT&CK: Credential Access – T1110.001 (Brute Force)
Using the discovered user accounts, the agent performs a brute-force authentication attack by systematically attempting multiple password combinations against a target account. Upon identifying valid credentials, the agent gains initial access to the environment and proceeds with the next stage of the attack chain.
ES|QL
FROM AItelemetry
| WHERE service.name == “redteam_crew”
AND span.name == “PasswordSprayTool”
| KEEP span.id,
trace.id,
service.name,
service.framework.name,
labels.command,
event.outcome

Filters telemetry generated by the brute-force authentication tool, capturing command execution details and the authentication outcome for the initial access attempt.
Stage 4 – Persistence
MITRE ATT&CK: Persistence – T1556.006 (Shadow Credentials)
Following successful authentication, the agent establishes persistence by injecting shadow credentials into the compromised account. This certificate-based technique enables future authentication without modifying the user’s password, providing a stealthier long-term access mechanism.
ES|QL
FROM AItelemetry
| WHERE observer.type == “apm-server”
AND labels.user_request RLIKE “Inject shadow credentials.*”
AND trace.id == “e88e7a3ce9ee80408150f46d8777e6ae”
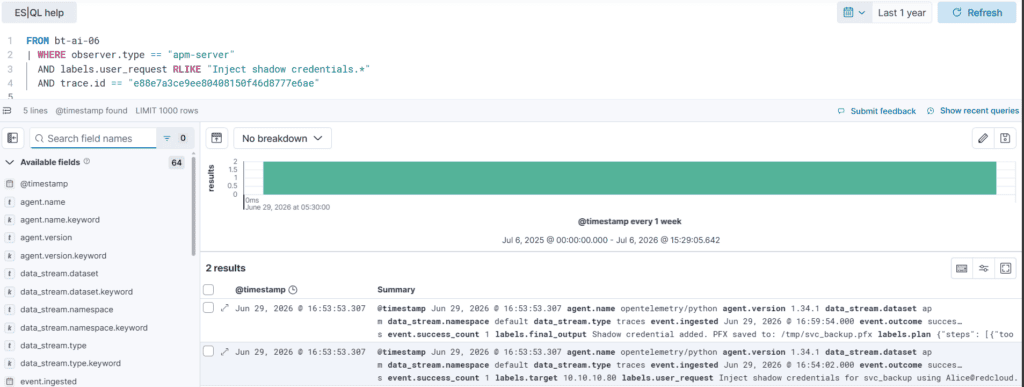
Matches AI telemetry containing shadow credential injection requests, enabling validation of persistence activity through trace-level correlation.
Stage 5 – Credential Access
MITRE ATT&CK: Credential Access – T1003.006 (DCSync)
With elevated privileges available, the agent attempts to retrieve Active Directory credential material using the directory replication mechanism. This enables access to credential data for privileged accounts without directly interacting with those accounts.
ES|QL
FROM AItelemetry
| WHERE service.name == “redteam_crew”
AND span.name == “DCSyncTool”
AND trace.id == “a218cb0e149774819063f48950064cc3”
AND span.id == “ee409b9583834c8f”
Identifies the DCSyncTool execution span using the associated trace.id and span.id, confirming the credential replication activity within the attack workflow.
Stage 6 – Lateral Movement
MITRE ATT&CK: Lateral Movement – T1550.002 (Pass-the-Hash)
Instead of relying on plaintext passwords, the agent reuses previously obtained authentication material to access additional systems. This enables lateral movement across the environment while reducing the need for repeated credential collection.
ES|QL
FROM AItelemetry
| WHERE service.name == “redteam_crew”
AND span.name IN (“PassTheHashTool”, “pth_exec”)
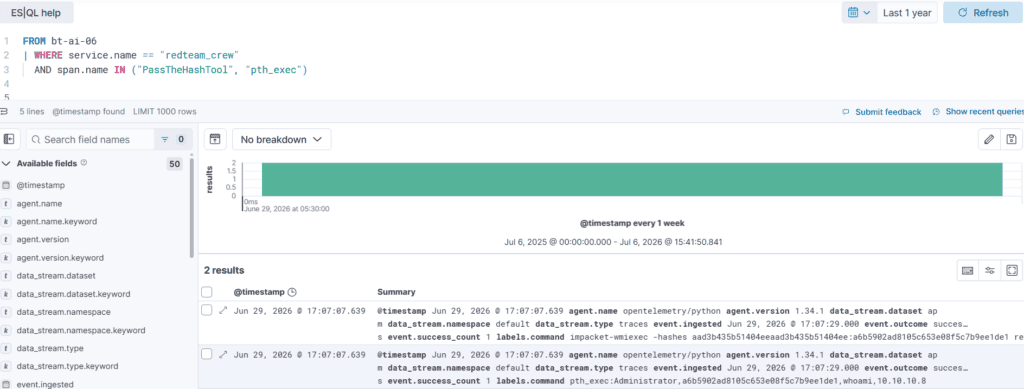
Filters telemetry for PassTheHashTool and pth_exec spans to detect hash-based authentication used during lateral movement
Stage 7 – Lateral Movement (Execution)
MITRE ATT&CK: Execution – T1059.001 (PowerShell)
Then the agent pivots from the Domain Controller to the Exchange server using remote PowerShell execution. Administrative commands executed through PowerShell enable the agent to continue operations on the target system and progress toward its objective.
ES|QL
FROM AItelemetry
| WHERE winlog.channel == “Microsoft-Windows-PowerShell/Operational”
AND event.code == “4104”
AND powershell.file.script_block_text RLIKE “\\$secpass = ConvertTo-SecureString ‘John@123’ -AsPlainText -Force.*”
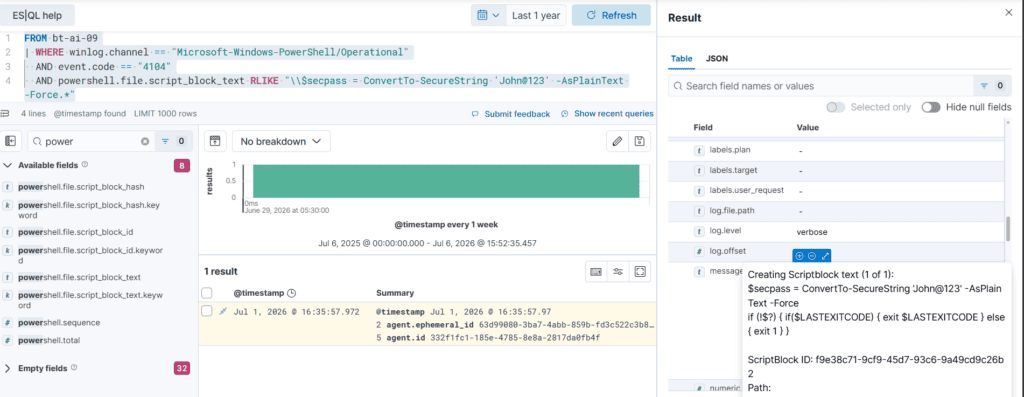
Queries PowerShell Operational logs (Event ID 4104) to identify remote PowerShell script execution associated with the lateral movement phase.
Stage 8 – Persistence / Collection Objective
MITRE ATT&CK: Collection – T1114 (Email Collection)
After reaching the Exchange environment, the agent completes its objective by establishing a covert mail-handling rule that provides continued access to organizational email traffic. This persistence mechanism allows ongoing collection while blending into normal Exchange operations.
ES|QL
FROM AItelemetry
| WHERE service.name == “redteam_crew”
AND labels.final_output RLIKE “.*Journal rule.*”
| KEEP span.id,
trace.id,
service.name,
Filters AI telemetry for Journal Rule creation events by matching the final execution output, confirming successful completion of the Exchange persistence objective.
Common Investigation Pitfalls:
Correlate span-to-span, not span-in-isolation : a single tool.invocation means nothing; the sequence across llm.completion → tool.invocation → llm.completion is the signal
Watch for identical reasoning across sessions : repeated gen_ai.prompt hashes or near-identical tool call sequences across trace IDs indicate scripted, not autonomous, behavior
Track token/cost anomalies as behavioral drift — sudden spikes in gen_ai.usage.tokens per span often precede a pivot or escalation attempt
Never trust truncated tool output : full tool.output capture is the only way to catch injected instructions or malicious payloads hidden mid-response
Alert on attack-chain-stage sequence violations : an agent jumping from Recon straight to Credential Access without Enumeration in between is itself a detection
Conclusion
Watching what an AI agent does isn’t enough , you need to see the reasoning behind it, step by step, to know whether it behaved the way it should have. This pipeline captures that full picture, from the moment an agent starts investigating a target to the last action it takes deep inside the network, and ties it all together so the whole story can be reconstructed from one trace. That’s the real shift here: instead of piecing together scattered logs after the fact, you get one connected timeline showing exactly how an attack chain unfolded.