Building an AI Observability Stack That Doesn't Fall Over: Why Separation of Concerns Actually Matters
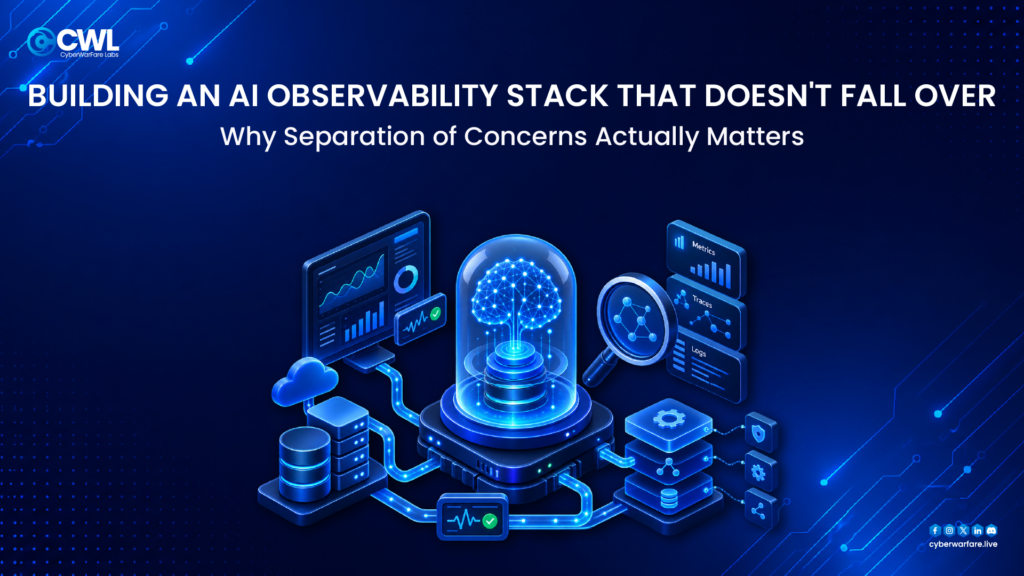
The Problem: Agents Don’t Fail Like Normal Software
Here’s the frustrating reality of running LLM-based agents in production: they don’t crash predictably. A REST API either returns 200 or throws a 500. An agent can return a perfectly well-formed, confidently incorrect response — wrong data, wrong tool call, subtle logic error – and nothing alerts you. You find out from a user complaint or a security audit, not from an error log.
That’s why this stack exists. It’s built around one principle: you can’t debug what you can’t see.
So the first decision: separate the inference layer from the orchestration and observability layer. This isn’t just about keeping GPU workloads away from log shipping (though that helps). It’s about giving each layer room to breathe, and giving you two different places to look when things go sideways.
PROD MACHINE 2: The Data & AI Backend
This machine is deliberately simple. Three services, each with a single responsibility:
Ollama Engine (port 11434) — Local LLM inference. You get sub-millisecond latency for model calls, no per-token costs, and zero external dependencies. If you’re doing retrieval-augmented generation, you’re calling this machine hundreds of times; you want it local.
Qdrant Vector DB (port 6333) — This stores embeddings for semantic search. When your agents need grounded context instead of pure hallucination, they query this. It’s also where you’d store long-term memory or knowledge bases that get refreshed regularly.
PostgreSQL (port 5432) — The relational backbone. Agent traces, decision history, structured records — anything that needs ACID guarantees instead of approximate similarity scores.
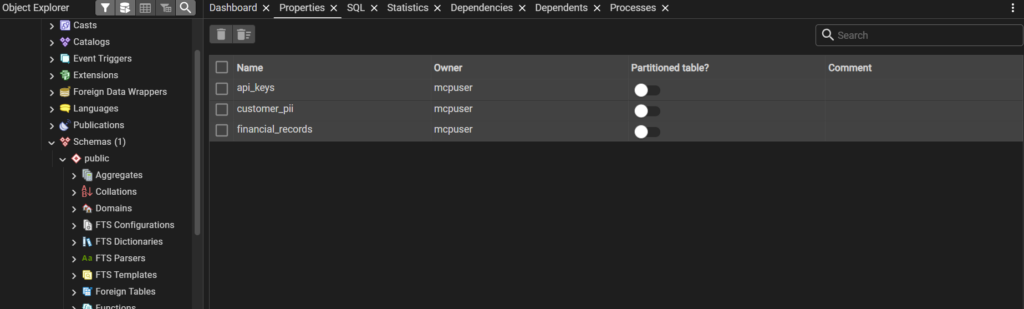
Notice what’s absent: no orchestration logic, no telemetry collection, no control plane. This machine answers questions and stays silent otherwise. The upside: when something’s slow, it’s genuinely just the models or the queries. No logging overhead, no competing processes.
PROD MACHINE 1: The Control & Observability Plane
This is where observability architecture meets real engineering decisions.
Local MCP Servers: Abstracting Tool Access
Two Model Context Protocol servers run inside the Python application:
Filesystem MCP Server — Standardizes file I/O for agents. Instead of agents hardcoding filesystem calls (dangerous, inflexible), they call this standardized interface. It handles permissions, path validation, and error handling in one place.
PostgreSQL FastMCP Server — Abstracts database access as tools. Agents see a clean contract: query_database(sql), insert_record(table, data). They don’t know about connection pooling or query optimization. You do, and you can change it without rewriting agent logic.
This abstraction matters because agents don’t need to understand implementation details — they just need to know “this tool exists and does X.” When requirements change (swap Postgres for a different DB, add caching layers, change permission models), you update the MCP server, not every agent.
LangGraph Agents: Orchestrator, Research, Data
Instead of one monolithic agent, three LangGraph-based agents work together:
- Orchestrator — Routes incoming requests to the right agent
- Research — Handles information retrieval and synthesis tasks
- Data — Handles structured data queries and transformations
LangGraph’s execution graph is load-bearing for observability. Agent state transitions are explicit nodes and edges — you can visualize exactly what happened at each step. When a workflow fails three steps in, you don’t get a cryptic trace; you get a graph showing which node failed and why.
Every tool call (internal or to MCP servers) generates a trace. Nothing happens silently.
OpenTelemetry Collector: The Failover Hub
OpenTelemetry runs as the single ingestion point for all traces, logs, and metrics from the agent layer. But here’s the clever part: it’s configured with three downstream sinks, and they’re not just backups of each other.
This is a fan-out with resilience.
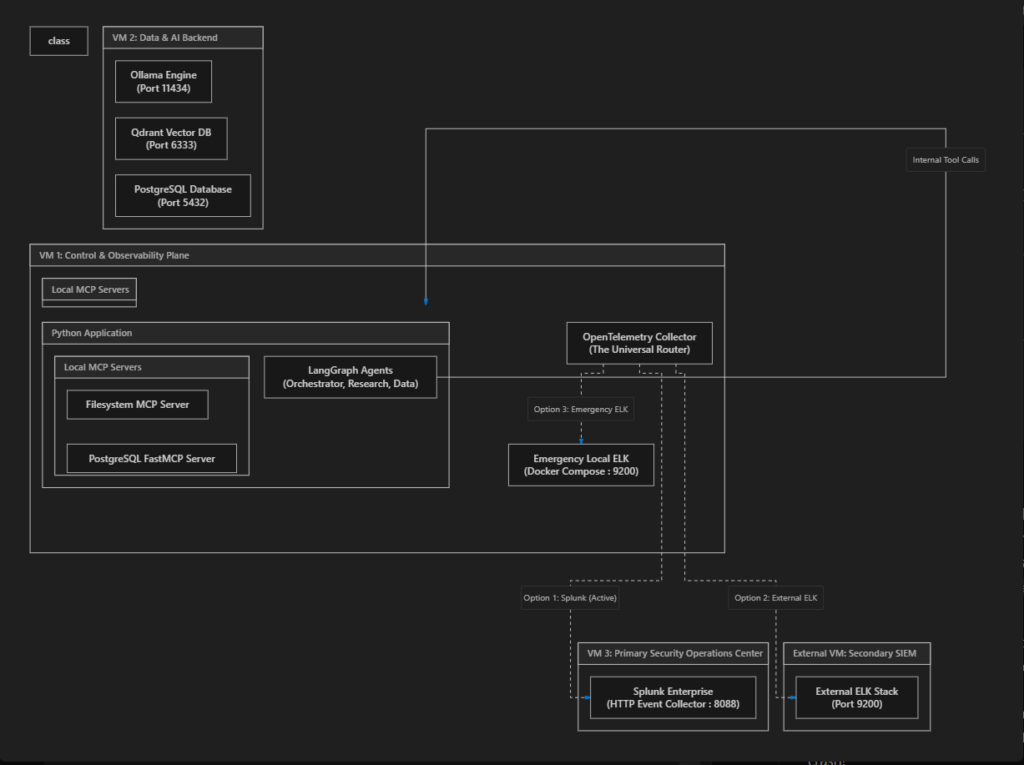
The diagram above represents the entire architecture we explained.
The Three-Tier Observability Strategy
Option 1 — Splunk Enterprise (Primary): Events flow via HTTP Event Collector (HEC) to VM 3, a dedicated Security Operations Center. This is your “everything working normally” path. Splunk understands agent traces, can correlate across multiple spans, and supports complex alerting rules.
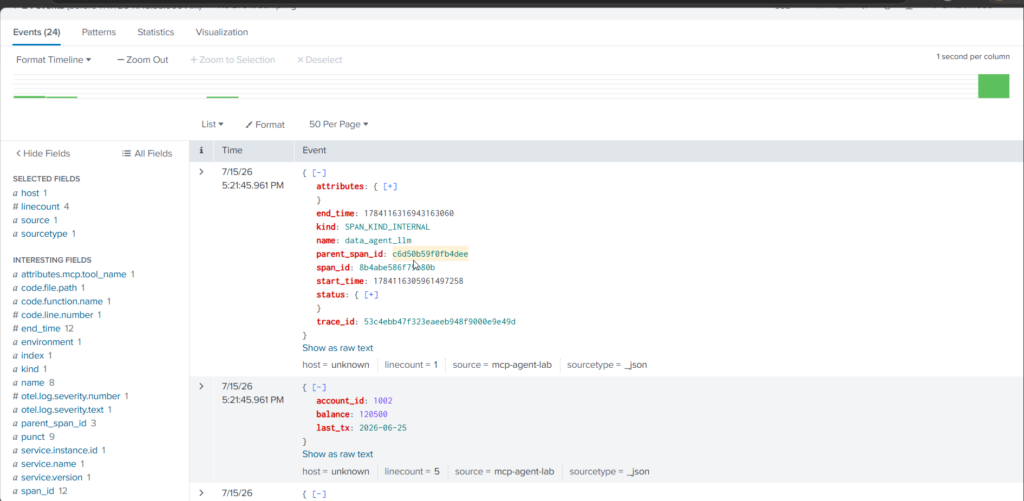
Option 2 — External ELK (Secondary SIEM) A separate external VM running Elasticsearch + Kibana. This isn’t a mirror of Splunk — it’s independently operated with its own indexes and retention policies. This is your “Splunk licensing expires” or “SOC VM needs maintenance” path. If you lose the primary, logs still land here.
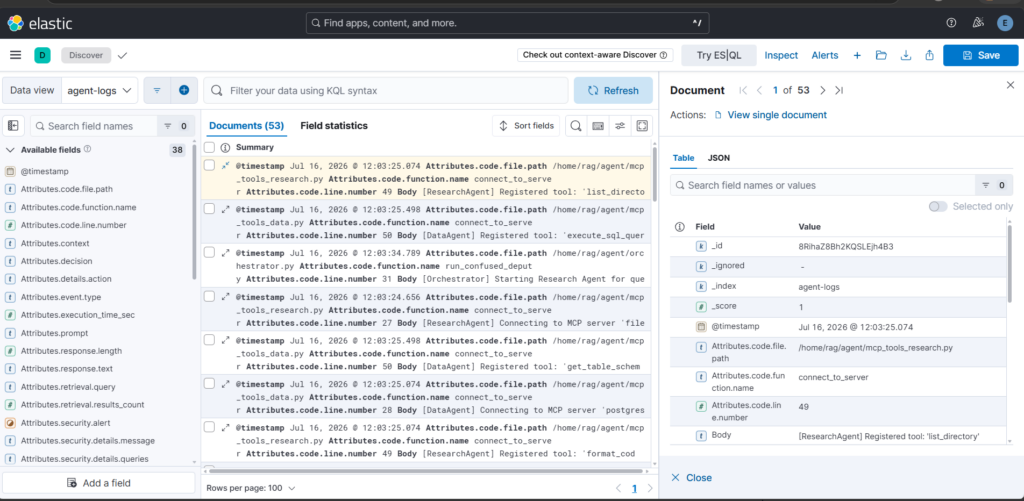
Option 3 — Emergency Local ELK (Break-Glass) Docker Compose-deployed ELK running locally on VM 1 (port 9200). No network dependency, spins up fast, purely local. This catches events even during full network partitions — the exact moment when observability matters most.
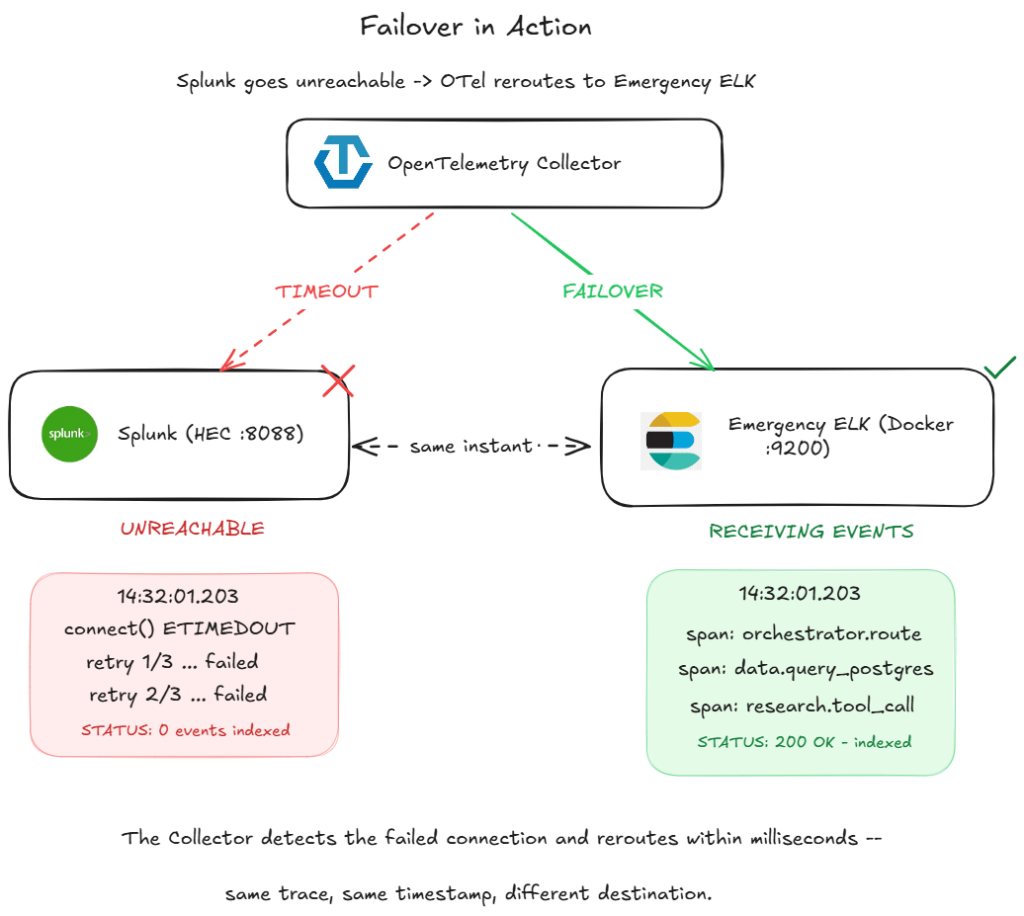
The OpenTelemetry Collector routes based on downstream health. Connectivity fails to Splunk? It tries External ELK. Both fail? Logs go local. Each sink is checked with health probes; routing is automatic.

Why This Matters in Practice
For Performance: Separating inference from orchestration means debugging an agent regression doesn’t compete with model inference for CPU/GPU. Your slow query traces won’t interfere with model generation latency.
For Extensibility: MCP servers provide clean interfaces. Adding a new data source (APIs, files, databases) means writing an MCP server, not modifying core agent logic. New engineers can understand a single service without reading the entire orchestrator.
For Reliability: Three independent observability sinks means you observe even catastrophic failures. During the exact incident when you most need visibility, you have it. Not because you’re paranoid, but because the system is honest: infrastructure fails, and you need to see what happened anyway.
For Debuggability: LangGraph’s explicit execution graph means you don’t debug via logs and guessing. You see exactly which decision node failed, what state it was in, what it was trying to do. Combined with full trace context from OpenTelemetry, you can reconstruct any workflow failure completely.
The Failover Moment: System Under Stress
Here’s what actually happens when Splunk becomes unreachable:
- OpenTelemetry Collector sends batch of traces → Splunk HEC times out
- Collector detects timeout, marks Splunk endpoint unhealthy
- Same batch immediately reroutes to External ELK endpoint
- External ELK accepts, confirms receipt
- Logs are indexed in seconds, same trace ID, same timestamp
Your agents never pause. No dropped events. No loss of observability during the failure itself.
If External ELK also fails? Local ELK gets the batch. You’re still capturing everything.
A monitoring system that goes dark during incidents is arguably worse than no monitoring at all. This design refuses to do that.
The Architecture Reflects Real Experience
The three-tier sink strategy isn’t theoretical. It’s built by someone who’s been on call at 2 AM when:
- Splunk licensing lapsed and log ingestion stopped
- The SOC VM was rebooting during an actual incident
- Network partitions meant external systems were unreachable
- The observability system itself was the thing that broke
Rather than hope these things don’t happen, the design assumes they will. Each layer has a fallback. Each fallback is independent.
The Takeaway
This isn’t about using fancy tools. It’s about design principles:
- Separate concerns across machines — Let each layer focus on its job
- Standardize tool access via MCP — Make adding capabilities easy, keep logic clean
- Make traces explicit — Use LangGraph’s structured execution model
- Assume observability fails — Build three independent sinks, not one
When you run autonomous agents in production, you’re admitting uncertainty. You’re saying: “I don’t know everything this will do.” That’s honest. So the observability system should be built on the same honesty: “The tools monitoring this might fail. Let’s make sure it still works anyway.”
That’s what separates a system you deployed from a system you can actually operate.